ARC 3.5m | TripleSpec
Last updated: Feb 23, 2016 - AB
**Note Currently only the 1.1" slit is available!
Click here for TSPEC Engineering Docs page
1. Introduction
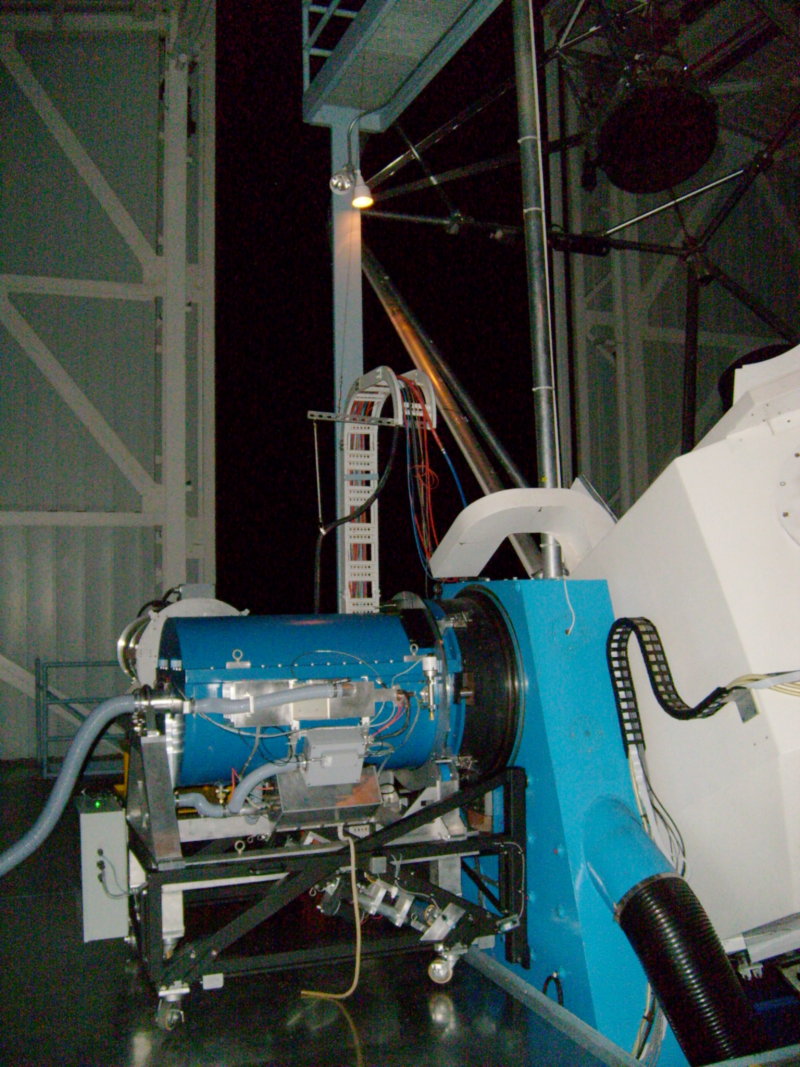
TripleSpec is a cross-dispersed near-infrared spectrograph that provides simultaneous continuous wavelength coverage from 0.95-2.46um in five spectral orders. The instrument is described in more detail in (Wilson et al. 2004). Users of TripleSpec should reference this publication in papers that incorporate TripleSpec results.
The primary configuration of the instrument delivers a spectral resolution of R=3500 in a 1.1 arcsecond slit at 2.1 pixels per slit on the spectrograph array. Slits with 0.7", 1.5", and 1.7" are also available. The instrument contains two independent infrared arrays. One provides a 2048x1024 pixel view of the cross dispersed spectrum. The second provides a 1024x1024 view of a 4'x4' region of the sky, including the spectrograph entrance slit, in the Ks (2.16um) band.
| Slits | 0.7x43" (120 microns projected width) 1.1x43" (186 microns) 1.5x43" (261 microns) 1.7x43" (290 microns) |
| Spectral Coverage | 0.95-2.46um |
| Spectral Resolution | 5000(?TBD) for 0.7" slit (undersampled and limited by optical performance) 3500 for 1.1" slit (2.1 spectral pixels per slit) 2800 for 1.5" slit 2500 for 1.7" slit |
| Gain | 3.5 e-/ADU +/- 20% |
| Read Noise | 18 electrons / sqrt(Nfowler) |
| Dark Current | 0.05 e-/s |
| Well/saturation Depth | 50000 DN = 180,000 electrons |
| Minimum Integration time | (Nfowler * 0.8 + 0.3) sec on sky (2*Nfowler * 0.8 +0.3) sec to estimate saturation |
| Spectrograph saturation magnitude | 4th (defocus for brighter objects) |
| Background limited exposure time | ~200+ sec |
| Slit viewer/ guider pixel scale (unbinned) | 0.245" /
pixel (175 pixel slit length) |
| Spectrograph spatial pixel scale | 0.39"/pixel (110 pixel slit length) |
| Guider/slitviewer bandpass | Ks only - fixed filter |
| Faintest practical source for acquisition in the slit viewer | Ks ~ 17 |
| Spectrograph continuum sensitivity | J, H, Ks = 17.0, 16.0, 15.5 5-sigma in one hour with 3 pixel spectral smoothing. 0.0003 Janskys (using 1.1" slit in good seeing) |
2. Usage Overview: What to expect
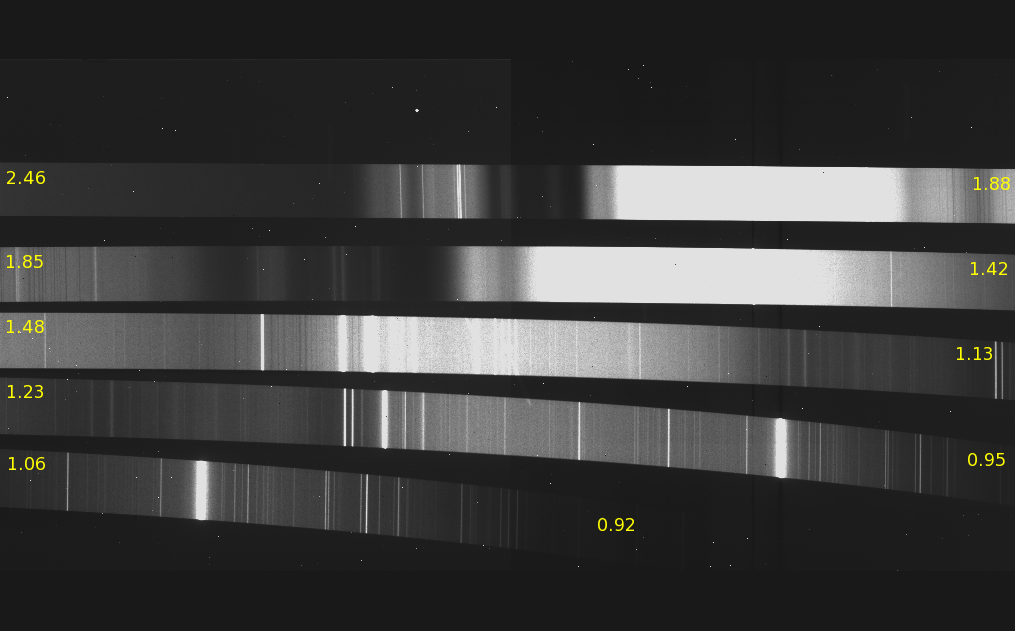
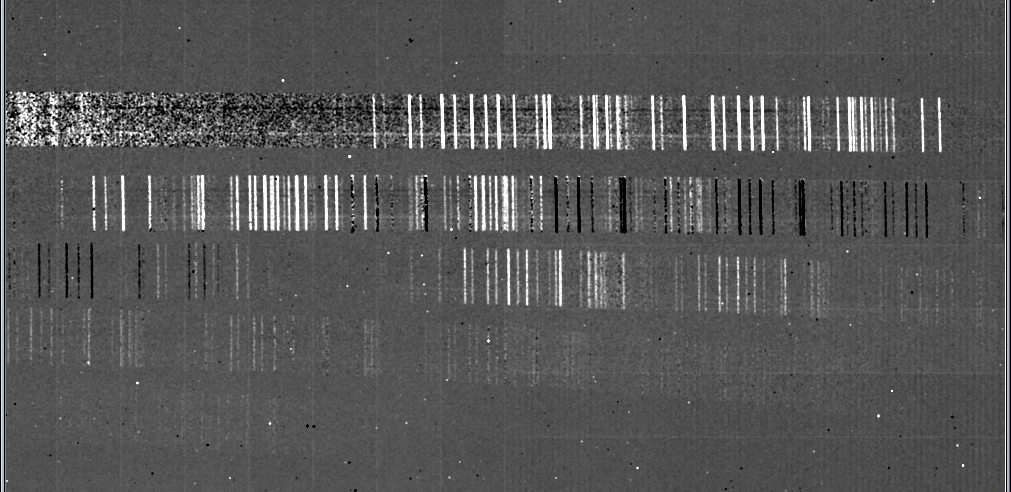
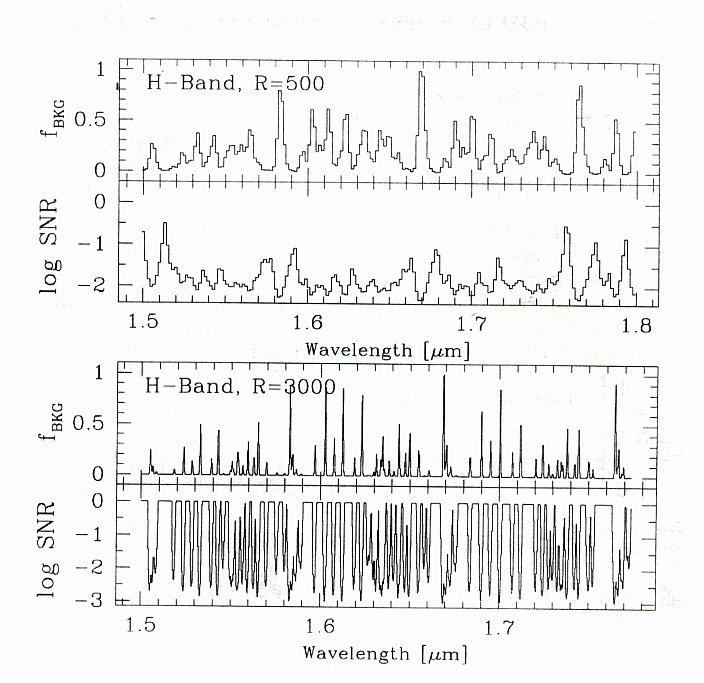
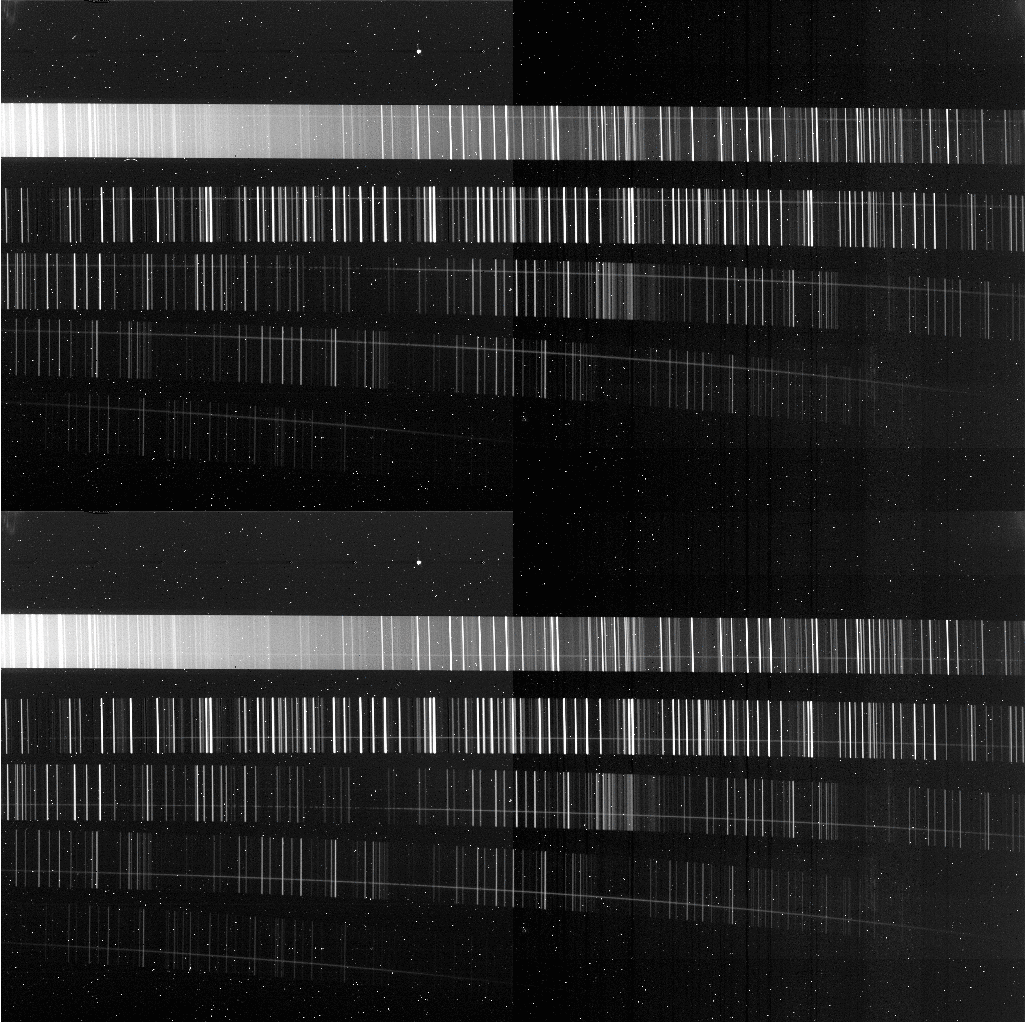
Unlike visible wavelength spectroscopy, substantial airglow dominates the near-infrared portion of the spectrum, particularly at wavelengths longward of 1.5um. Beginning at 2.0um and longward a significant ambient thermal radiation component begins to contribute Poisson noise. The spectrum below illustrates these effects on a faint (J, H, Ks ~ 14 mag) object. The animation shows the star observed at two slit positions as is typical for TripleSpec observations. Evident are bright airglow emission lines filling the slit, particularly in the H-band (2nd from top) order. Wavelength increases to the left, and the rising thermal emission in the K-band order (top) is evident as well. Scattered high dark current pixels pepper the array. Pixels that blink on are off are cosmic ray hits. The exposure time for this image is 120 seconds.
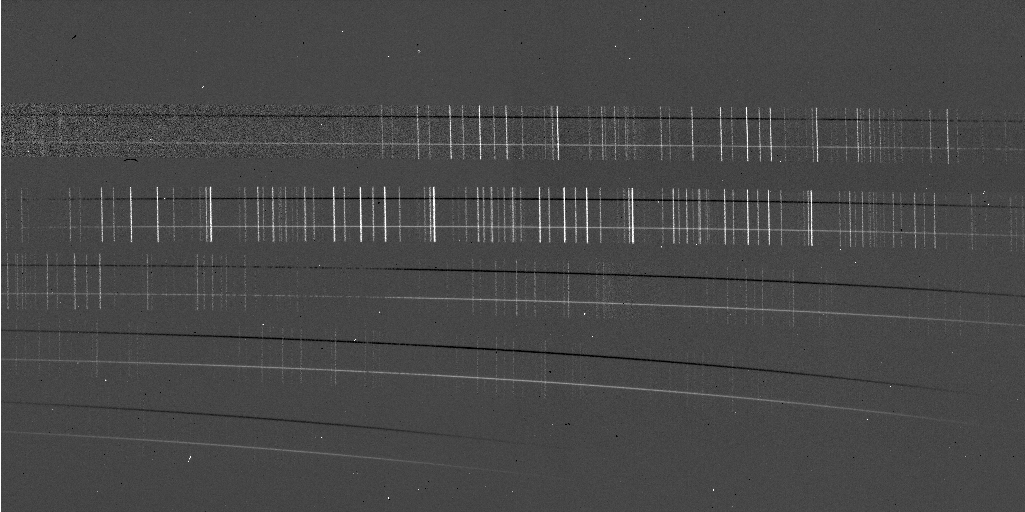
Typically spectra are acquired at two slit positions and subtracted to suppress airglow line emission and thermal emission. The difference spectrum below shows the enhanced visibility of the spectrum in such a difference. Residual airglow lines are still present due to temporal variability in airglow, even on timescales of a few minutes. For longer integration near zenith, the small amount of flexure in the instrument (max 1 pixel) can also influence the self-subtraction of the airglow lines. Increasing Poisson noise from K-band thermal background is evident at the longest wavelengths (upper left).
3. Sensitivity and Performance
-
GD153 is a DA white dwarf with an effective temperature of
39,000K. The infrared portion of the spectrum of this object
is approximately Rayleigh-Jeans. GD153 has a V-band Johnson
magnitude of 13.35. The UKIRT faint standards list reports the
star (FS33 in the UKIRT list) as 14.24 at K with H-K = -0.078
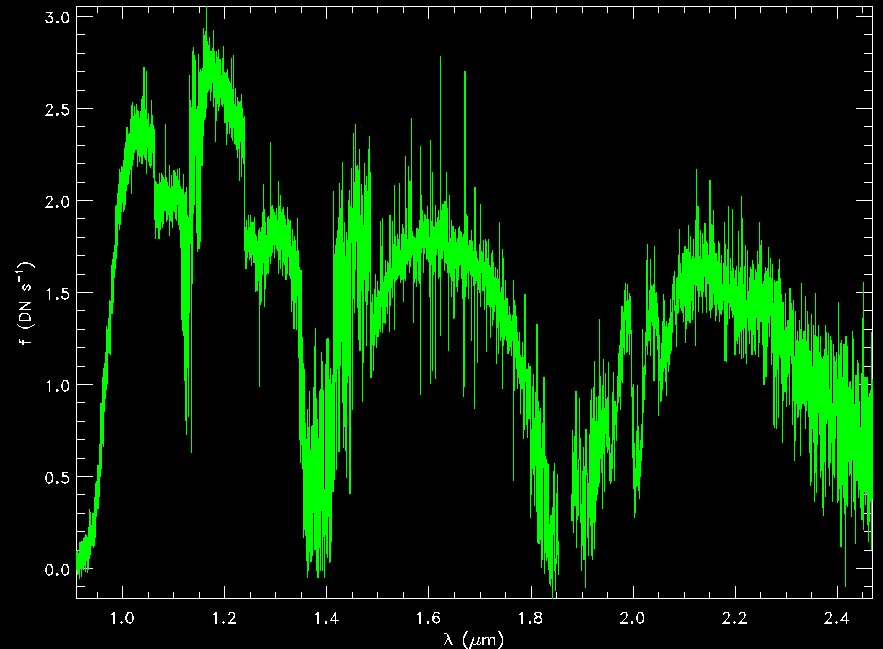
and J-K=-0.223. The figure at left below shows the counts in
units of DN/s based on eight 120 seconds spectra of this
object. In this figure the flux in different orders has been
merged to give a total system response as a function of
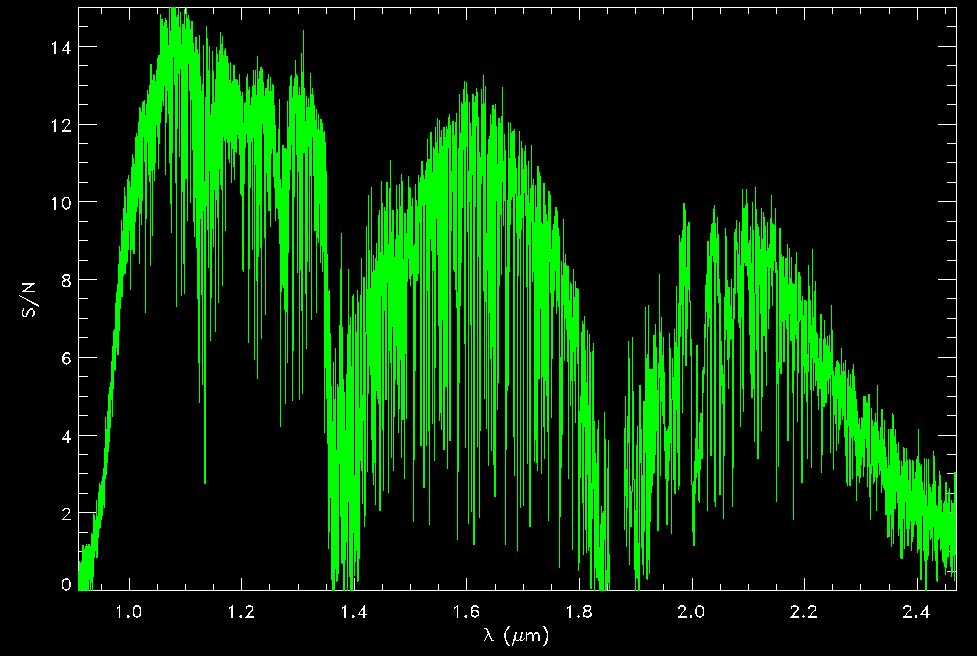
wavelength. The adjacent figure gives the S/N per spectral
pixel for this object in the full 8x120= 960s integration.
Evident is the efficiency function of each of the orders,
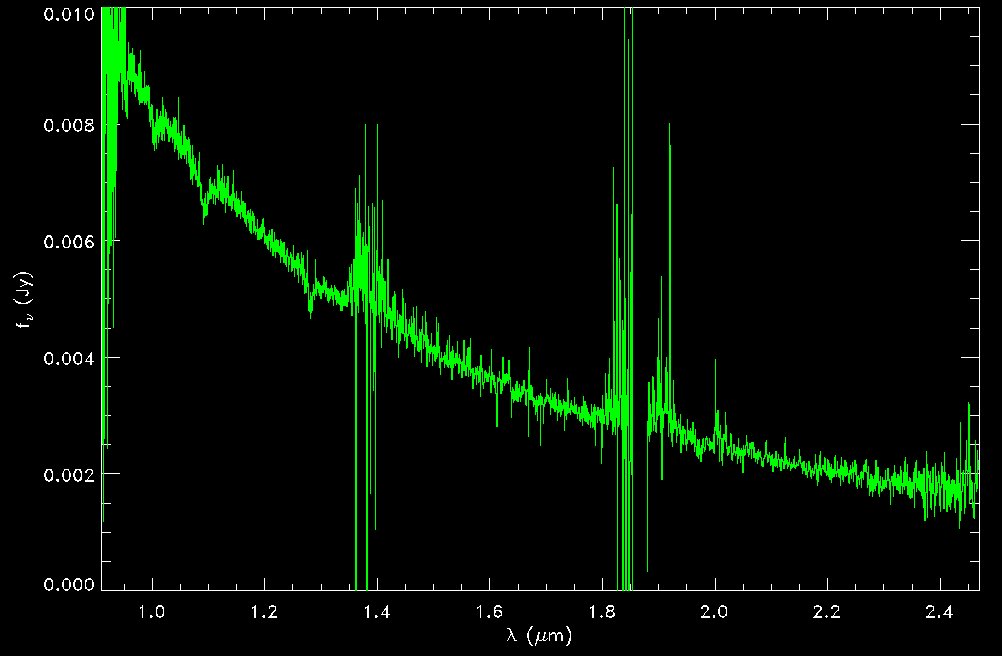
peaking near the center of the order. The third figure shows
the calbrated response for this object in Janskys.
Based on the observation of this 14th magnitude white dwarf SNR=5 can be achieved in one hour in a three pixel spectral bin at magnitudes K=15.5, H=16.0, J=17.0.
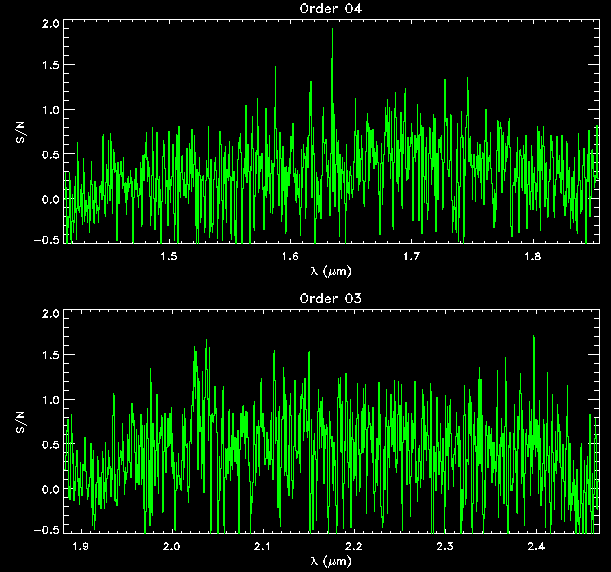
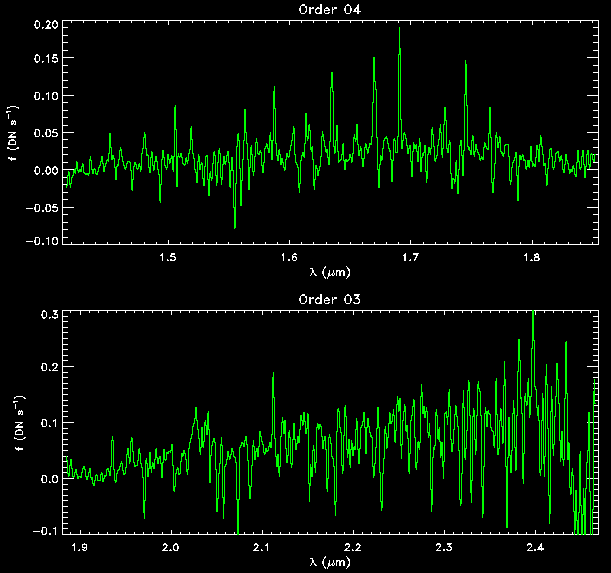
3.1.b. The limits of detectabilityThe images below shows the K-band detection and extraction of a faint red source in one hour of integration time. During that hour the source was observed in twelve five-minute integrations, alternating in slit position ABBAABBAABBA. The count rate of 0.07 DN/s corresponds to a K=17.5 mag continuum. With three pixel spectral smoothing the continuum has an SNR=0.5 per smoothed spectral bin. In order to produce a spectrum bright enough for extraction, the five minute integrations had to be binned into 30 minute stacks at the "A" and "B" positions. Overall, this spectrum may not be very useful scientifically, but it does illustrate the limits of detecting and extracting a source spectrum under good conditions at the 3.5-meter.
Note that although the extracted continuum K-band magnitude is 17.5, the reported source K-band magnitude was 15.8. The observers struggled to guide on this faint target and the lower than expected detected magnitude is likely due to losses experienced in attempting to keep the light going down the slit.
The sensitivity of the slit viewer dictates the faintest source that can be observed directly and placed on the slit. Below this sensitivity threshold observers will have to depend on blind offsetting to place a source on the slit. In general, if a source is too faint to be seen in the slit viewer its continuum will be difficult to detect in the spectrograph. The integration time for the slit viewer is adjustable, but 30 seconds represents a maximum practical integration for positioning the source and for guiding. Longer integration times are possible, but the delay between exposures makes guiding and/or positioning the source on the slit tedious. In addition, since the slit viewer operates at Ks-band, significant thermal background accumlates during an exposure and will eventually saturate the array. The time to saturation is a strong function of ambient temperature. As a reference point, a recent observer found that the array was saturating in 45 seconds under warm (60F) conditions. Given blackbody emission at ambient temperature, the time to saturation will be four times longer at 32F. . The slit viewer is thus about a magnitude more sensitive under winter conditions than during the summer for the same integration time. Observers with extremely faint targets may wish to consider this fact in scheduling observations.
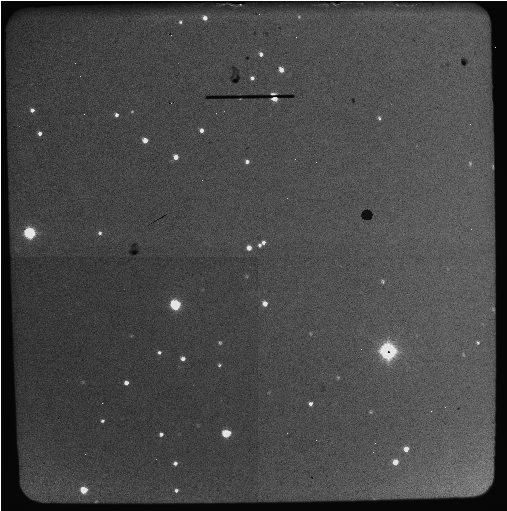
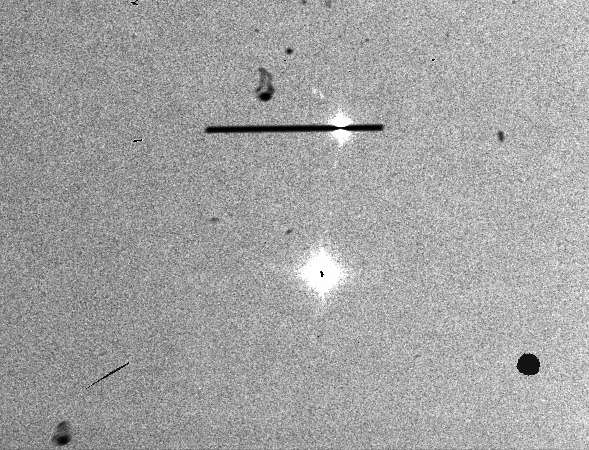
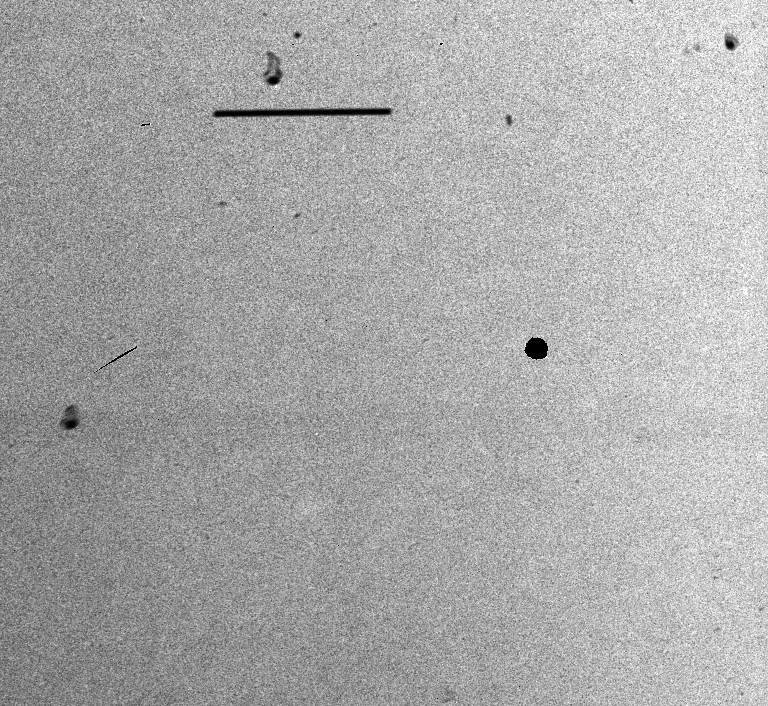
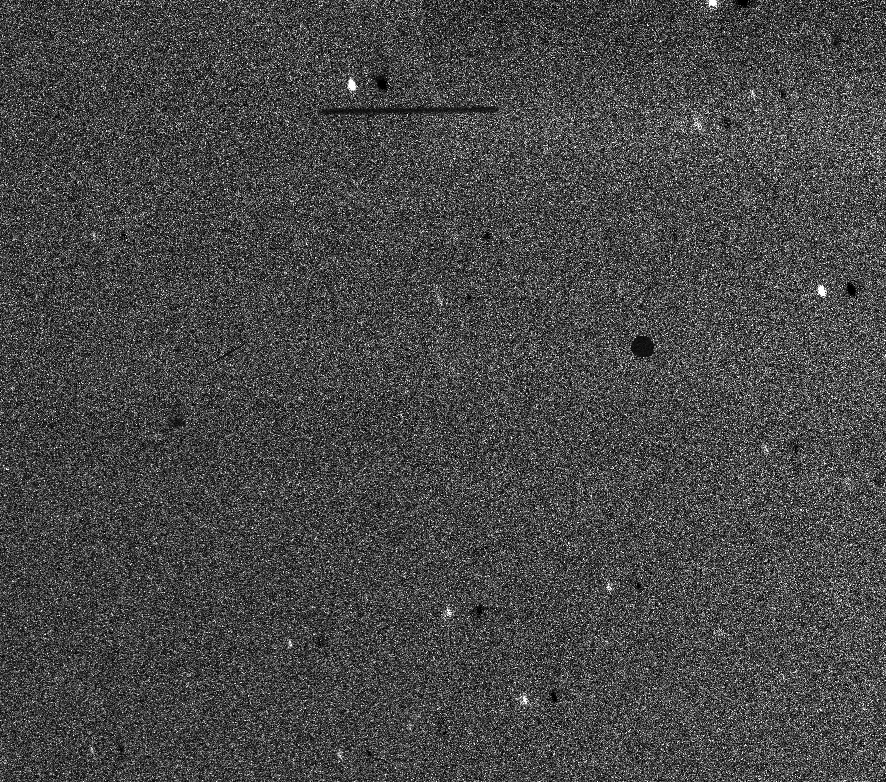
Once again GD153, K=14.2, provides a fiducial for slit viewer sensitivity. The frames below show, first, a raw guider frame with a bright source (not GD153) on the slit at the "B" position. The second figure shows a raw guider frame on a field containing many detectable faint sources (including GD153 just above the slit) - all of which are difficult to see in this view. As outlined below (see sections 4.2.a. and 5.1.c), collecting a background frame, shifting the field-of-view and subtracting that frame from subsequent frames removes all common-mode signals and provides a cleaner view of the sky. In this view (on the far right, with integration time of 15 seconds) the K=14.2 mag GD153 (just above the slit) is well-detected. The faintest stars readily visible are about 2.5 magnitudes fainter than GD153 or around K=16.5. With 30 second guider integrations it will be possible to see K=17 sources and place them on the slit. Longer guider integration times are likely to be unwieldy.
Boresite guiding requires sufficient spilled light to enable the guider to track the star (e.g. the leftmost figure below). The faintest start that provides sufficient spilled light has yet to be determined, but is probably in the range of Ks=13-14.
Guider sensitivity will depend on conditions - seeing and ambient temperature in particular. The example frames were obtained on a night with T=0C and sub-arcsecond K-band seeing and thus represent nearly the ultimate performance for this channel. At T=15C the system will be approximately 0.7 mag less sensitive than at T=0C under similar seeing conditions due to the increase in thermal background.
Given that the slitviewer/guider operates at Ks band and that the spectrograph has high spectral resolution, the sky is dark enough for source acquisition and sensitive spectroscopy when twilight is quite bright to the naked eye. Sunlight begins to interfere with five minute spectral integrations when the Sun is 6 degrees below the horizon. The Sun typically reaches this position 30 minutes after sunset or before sunrise. A TripleSpec night begins early and ends late. Users should be prepared for initial source acquisition shortly after sunset.
- Move telescope to target. Typically the source will appear within a few arcsecond of the slit. Since the field of view is 4'x4' it is unlikely the target will fall outside the field of view. (Note that the slit mirror has a few defects, one of which is close to the primary slit (1.1 arcsec)). On occasion, the target may land on the defect (or in the slit itself) rendering the source invisible if the target is faint. If the desired source is not evident, a few arcsecond offset may turn it up.
- If the source is faint it may be necessary to detect it in a difference between two guider frames. See section 5.1.c for explicit instructions on how to initiate background subtraction from the TUI TripleSpec guide window.
- Place target in the "A" slit position.
- Ctrl-left click if not already selected with green circle and marks on the target, then click Center Sel button to offset the telescope to the marked hotspot (which should be placed at the A position).
- By convention the A position is about 1/3 slit length from the left edge of the slit as seen in the guider display. Similarly the "B" position is about 1/3 slit length in from the right end of the slit.The displacement between the A and B positions is about 20 arcseconds.
- Set the number of Fowler samples, integration time, and source name in the TripleSpec instrument/expose windows. Shorter integrations provide better immunity to airglow line variation, however, the background limit - set by the inter-line airglow continuum, is reached only after about 3 minutes of integration. Five minutes of frame integration time is a practical and useful upper limit.
- Either
- Select an ABBA nod sequence (which should automate the positioning of the source at the alternating slit positions) or
- Expose on the "A" position and manually offset and integrate for an ABBA sequence.
- Repeat as desired.
4.2. Source and Guide Star Acquisition
For bright sources, positioning a target on the slit is straightforward. Once a source is identified in the slit viewer, click Center Sel button to move the target to the "hotspot" location on the slit. Click Guide. The spilled light out of both sided of the slit should provide symmetrical guiding in boresite mode and integration can begin.
For faint sources attention will be required to maximize the source signal in the slit viewer images - which to 0th order is accomplished by increasing the frame integration time. There are two routes to obtaining optimal SNR in the slit viewer. The best practice remains to be determined.
In the background subtraction mode a single frame is buffered and subsequently subtracted from each incoming guider frame. The subtraction removes all of the common mode structure that contaminates a raw frame and makes faint sources visible at the expense of providing a (+) and (-) image of each source. The telescope must be offset a few arcseconds following the acquisition of the background image otherwise sources will subtract from themselves making them invisible. Implementing the background subtraction mode with TUI is described below in Section 5.1.
The masks applied by the TUI guider have a pixel-to-pixel scaling that effectively flat fields the incoming frames. Typically, thermal infrared dominated frames are not simply flat-fielded because of structure arising from non-sky emission (consider the glow from a speck of dust on the window). For the sake of source acquisition and guiding such features are more of an annoyance and it may be possible to acquire even the faintest sources if the flat fielding is effective (and avoid the sqrt(2) noise penalty entailed by background subtraction). By the time of shared-risk observing it may be possible to do faint source acquisition on the masked (proc) guider frames.
The spectra above show that there is substantial airglow contamination across the TripleSpec bandpass. If consecutive exposures place a point source at two well-separated in-slit positions, subtracting these two spectra will, to first order, suppress the airglow line flux while maintaining the full signal from the target. The airglow line intensity can vary substantially even in the course of several minutes. In order to get good subtraction of the airglow lines integration times of less than 5 minutes are desirable. (In theory, the airglow should be removed in data processing as the slit region outside the source is fit and subtracted from the source. In practice the angle of the slit varies with respect to the dispersion direction making clean subtraction difficult - thus the desire to suppress/minimize the airglow signal.)
TripleSpec has four available slits. The primary TripleSpec design implements a 2.3 pixel wide slit which corresponds to a cross-slit spatial dimension of 1.1 arcseconds. The three other slits are 0.7, 1.5, and 1.7 arcseconds wide. These four slits reside on a gold-coated silicon wafer slit mirror supported on an 8 position geneva gear mechanism. A pulldown menu in the TripleSpec TUI Configuration window permits selection of slits (or selection of blocked positions halfway between slits).
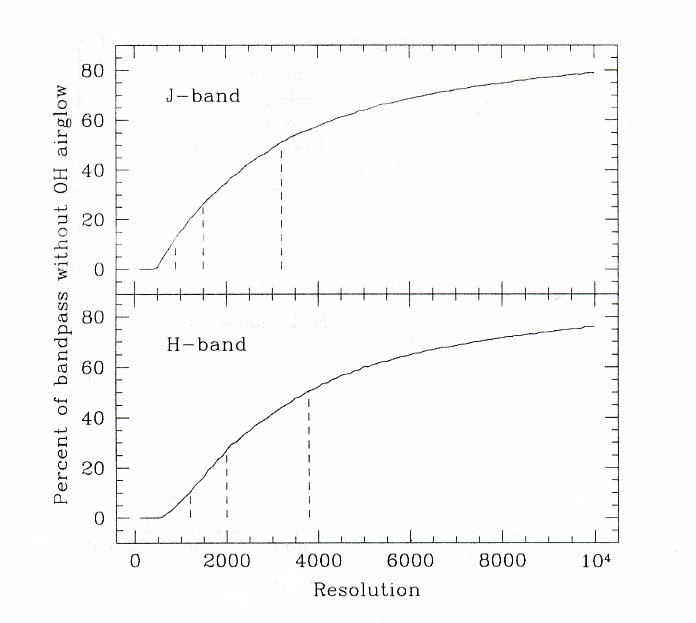
Due to the substantial airglow across the TripleSpec bandwidth there is a sensitivity penalty in addition to the resolution penalty incurred when using wider slits. The airglow lines become broader thus covering more of the spectrum. More flux is admitted into the instrument overall yielding more scattered light. If seeing allows, the 1.1 arcsec slit is optimal for observation. Although the 0.7 arcsec slit is even better in this regard, it subtends only 1.5 pixels and is undersampled. The figures below graphically illustrate the improvement in uncomtaminated spectral coverage vs. resolution.
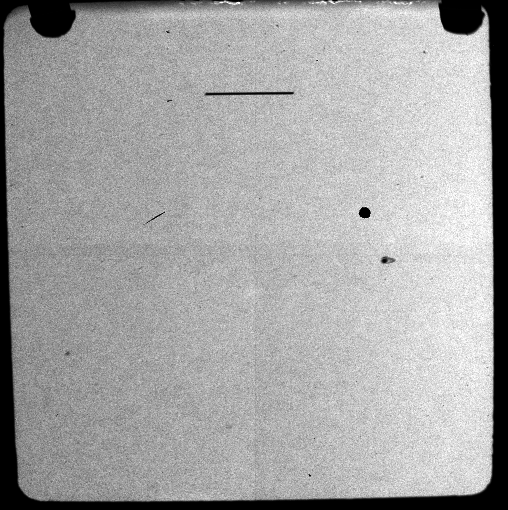
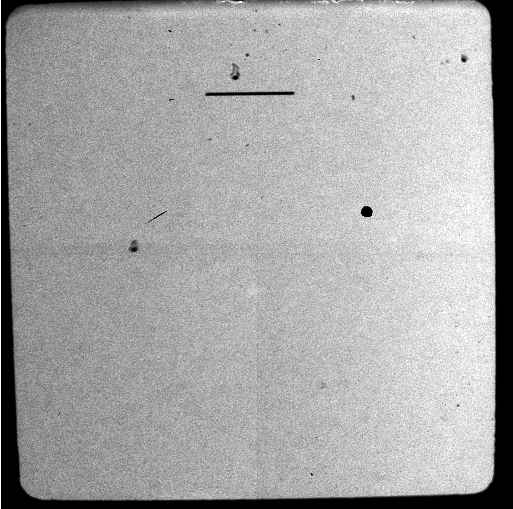
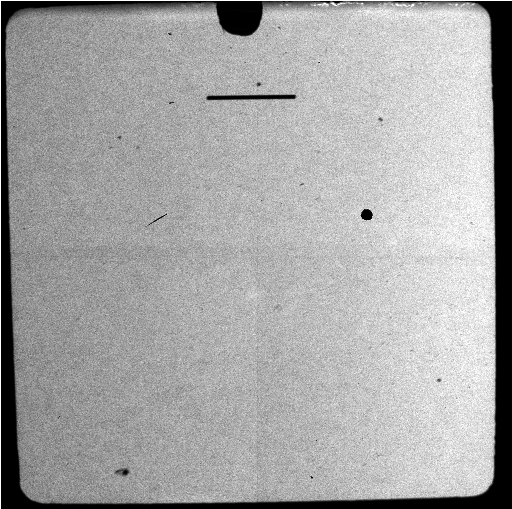
The table below shows raw (2x2 binned) guide frames in each of the slits. The patterns from the slit mirror defects/mounts are evident in each case.
 |
 |
 |
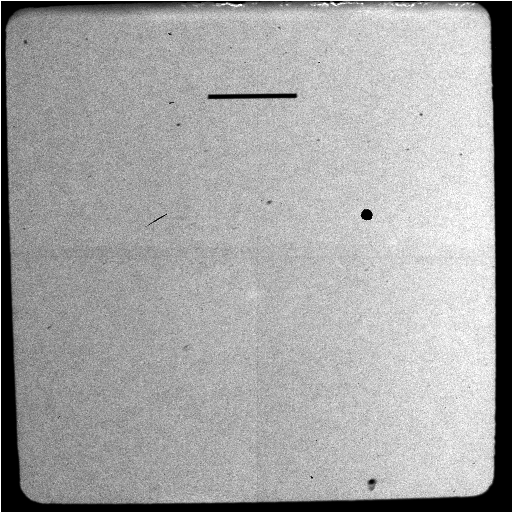 |
| 0.7 arcsec | 1.1 arcsec | 1.5 arcsec | 1.7 arcsec |
4.5. Fowler sampling, read noise, and minimum integration time
4.5.a. Fowler sampling and read noise
The HAWAII-2 spectrograph array can be read non-destructively multiple times during the course of an integration. Fowler sampling refers to conducting a burst of N readouts at the beginning of an integration and an equal burst of N readouts at the end of integration in order to suppress read noise (FowlerN). Read noise suppression can be important for TripleSpec, since the dark current is 0.05 e-/s and the inter-airglow line continuum is weak. For correlated double sampling (one read at the beginning of an integration and one at the end - also ``Fowler1") TripleSpec read noise is observed to be 5DN or 17 electrons. The TripleSpec TUI configuration menu permits the user to select a range for the number of Fowler samples. The TripleSpec read noise is observed to improve, as expected, with the square root of the number of Fowler samples. With Fowler8 the effective read noise is about 7 electrons. After the collection of 100 dark current or sky electrons these factors will dominate the read noise.
4.5.b Integration time and saturation
Integration/exposure times for direct readout devices can be non-intuitive since there is no shuttering and the conversion of the first and last pixels in one read of the device are staggered in time. For the TripleSpec HAWAII-2 array the electronics require 792 milliseconds to address all pixels on the array (in 16 128x1024 stripes of pixels read out in parallel). As an example, consider a Fowler1 integration. The array is reset, establishing the saturation level and the first pixel of first readout (actually 16 all at once) is read. 792 milliseconds later the last pixels of the read arrive. The image captured is thus staggered in time from one end of a stripe to the other by 0.8s. An 0.3 second delay is enforced prior to the second readout in order to avoid spurious ``shading" across the image. If the second readout begins immediately after this 0.3 sec delay (thus realizing the minimum integration time) the first pixel will be read out 1.1s after it was read the first time, and so on for all of the pixels on the array. Despite the fact that 1.9s was invested in acquiring the data, the image produced by differencing the two readouts has an on-sky exposure time of 1.1s. The beginning of the last readout started 1.1s after reset while the end occurred 1.9s after reset - the saturation threshold varies across the chip! Saturation should be considered including all of the readout time, not just the on-sky integration time. For Fowler1 the minimum on-sky integration time is 1.1s, but saturation should be presumed to be estimated from a virtual 1.9s exposure.
Generalizing to FowlerN, N*0.8s is required for the first readout sequence as well as for the second readout sequence. At minimum integration time, currently with an 0.3 second delay between the last pixel of the first sequence and the first pixel of the last sequence, 0.3+2*0.8*N seconds are required to execute the entire sequence while 0.3+0.8*N seconds of integration are obtained on sky (which can be seen also by subtracting pairwise the first read of the first group from the first read of the second group, and so on).
TripleSpec software accounts for the readout time in all Fowler modes such that the on-sky time will be the requested duration. This value will also appear as EXPTIME in the frame FITS header (another keyword INTDELAY provides the implemented delay interval between the last pixel of the first read and the first pixel of the last read).
The choice of N dictates the minimum on-sky integration time. A typical value is Fowler8 - enabling integrations as short as 6.7 seconds. Virtually all TripleSpec targets, including calibrator stars and calibration lamps, are observed with integration times longer than 10 sec. N=8 is the recommended Fowler setting for all TripleSpec data acquisition, unless exposures with duration less than 7 seconds are required. This is not the default setting, it needs to be set by the user.
The HAWAII-1 slitviewer/guider array could be read out in FowlerN mode, however the level of thermal background on the array produces thermal Poisson noise far in excess of the system read noise (also of order 17 electrons). In the interest of dynamic range and efficiency, the HAWAII-1 array only operates in Fowler1 (CDS) mode.
4.5.c Exposure sequence details
Matt Nelson has provided the following detailed breakdown of the exposure sequence:
1 - ICC receives exposure request
2 - ICC calculates and sets exposure time (SET cmd to controller)
3 - Controller finishes loop in Continuous Reset, Processes command
and replies to ICC.
4 - ICC initiates exposure in controller
5 - Controller finishes loop in Cont Reset, Breaks out of
loop to expose
6 - Controller does full pixel by pixel reset of array
7 - Controller Delays for reset settling
8 - Read-1 reads are made
9 - Controller waits for calculated Integration time
10 - Controller waits for 400mS for Array outputs to stabilize
11 - Read-2 reads are made
12 - ICC finished scavenging last Read-2 read, builds frame and
writes it to disc.
13 - ICC replies "done" to hub
Guesses about timing.
1-4 should be relatively fast. The line loops in continuous reset are
quite quick so I would expect this sequence to finish in < 10mS
5-6 was never timed by me. What I recall from the pixel clocks when I was developing the DSP code is that the reset pixel clock was running about 1/3 of a normal readout pixel clock. So I'd guess ball park 200-300 mSec for this
7 50mS
8 N*790mS
9 Exp Time - N*790ms
10 400mS
11 N*790mS
12-13 Unknown but fairly quick. Most of the frame data are scavenged and averaged while the pixels are still being read. it is just the recovery time of the last frame, subtraction of the Read1/2 the writing of the frame to disc. I'd estimate 100mS-200mS nominal timing.
Of course what is missing is the time required for the hub to cycle back around to requesting the next in the frame series. I'm certain the APO staff would have a good estimate. As a summary, the ICC and controller are probably using up 250+50+400+150mS = 850mS of time beyond the time spend during integration + readout. So for a rough estimate of instrument cycle time beyond the requested integration time 850+790*N mS should be close.
4.6. Dark Current and Frame Offset Level
The dark current in the spectrograph HAWAII-2 array has been measured on the mountain to be of order 0.05 e-/s or 15 e- in a 300s exposure. To first order dark current is unobservable in a 300s exposure, particularly because electronic offsets (e.g. the thermal drift of the cold output transistors) can be much larger than the few DN of dark current (e.g. a random 300s frame was observed to have an offset level of 130DN - virtually all electronic). The focal plane is quite dark between the orders. Raw frames may have a positive or negative offset in this region that is not due to electrons in the wells. Typically the subtraction of two consecutive frames (as is natural in processing ABBA observations) will surpress much of this electronic offset.
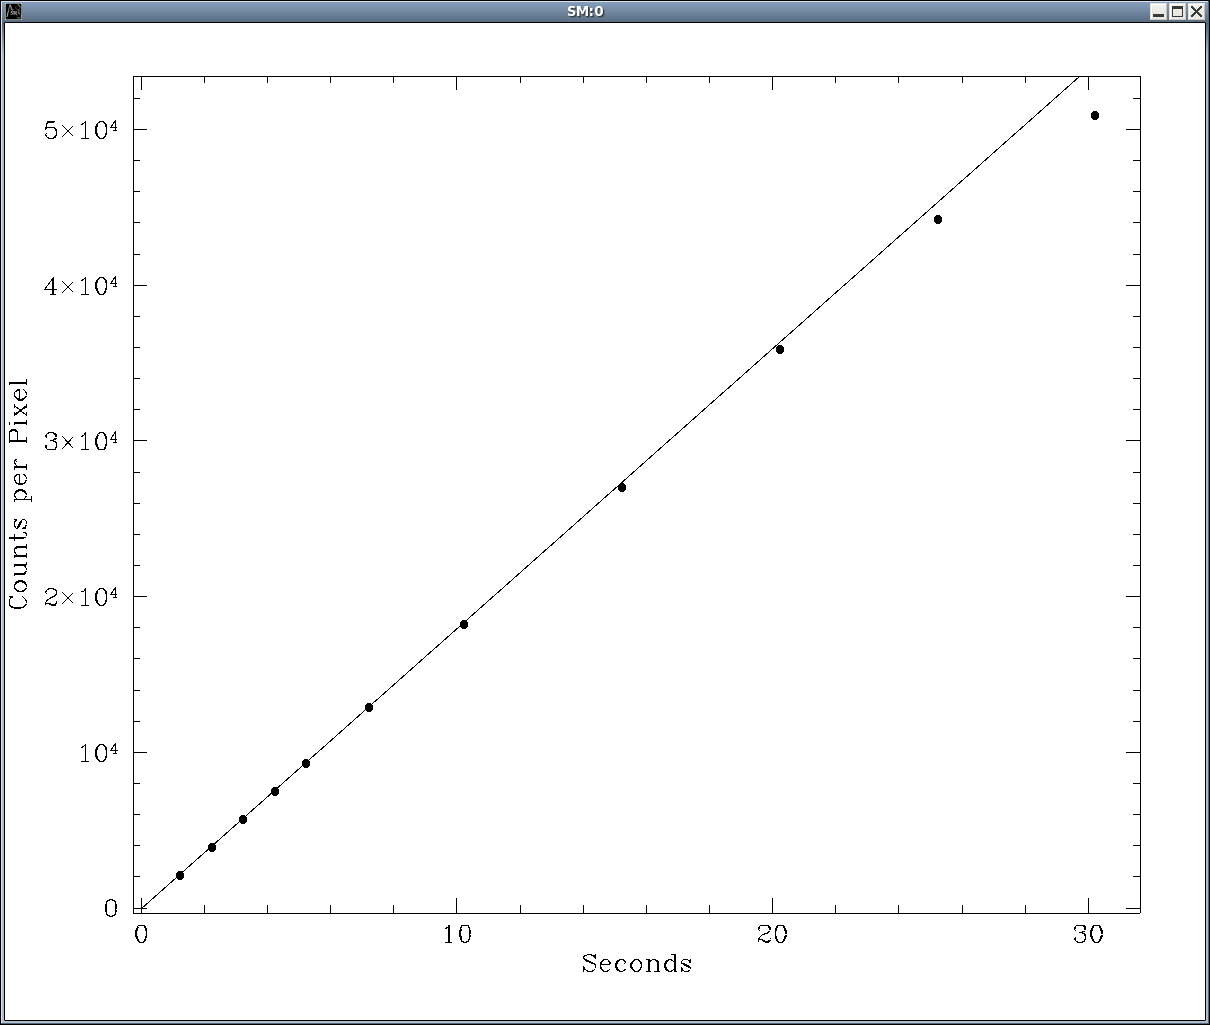
The spectrograph array saturates at a level of 52,000DN. Measurable (but small) linearity becomes apparent by a count level of 20,000DN. The plot below summarizes a continuum linearity test observing a constant background level at various integration times. A linear fit was made to the points having integration times between 2 and 8 seconds (count levels between 4000 and 13000 DN) which represents the most linear and reliably measured portion of the curve. The table below summarizes the quantiative non-linearity from this fit. The lines highlighted in green contributed to the linear fit. The short integration time points are deviant because the integration time offset was not precisely determined for these data.
Seconds Deviation Counts from Linear
---------------------------------
1.21 1.9% 2127
2.21 0.5% 3945
3.21 -0.2% 5774
4.21 -0.2% 7578
5.21 -0.1% 9371
7.21 0.1% 12942
10.21 -0.5% 18263
15.21 -0.9% 27091
20.21 -1.1% 35950
25.21 -2.5% 44260
30.21 -6.5% 50976
Simply put, good focus is obtained by making the TripleSpec guider images round. The guider optical train has astigmatism that enters quickly as the telescope goes out of focus. The good news is that this astigmatism is in the guider optics and not in the spectrograph optics, so the astigmatism serves as a focus tool without influencing the quality of the star image that is actually going down the slit. Seen a different way, the guider image can look poor and astigmatic (within limits) yet the image is still optimal for the spectrograph. The position angle of the astigmatic image is a guide to the direction to move the focus (soon to be documented by the obs specs). In practice, it is probably better to adjust the guider images on the fly to remove any evidence of astigmatism rather than to focus using a script that drives the telescope well out of focus.
Update based on limited observations on UT080907: If the image appears elongated more-or-less parallel to the slit the focus needs to be made more negative in order to return the image to a circular shape.
K~10 stars make for good focus targets.
4.9. Spectrograph Frames under the Microscope
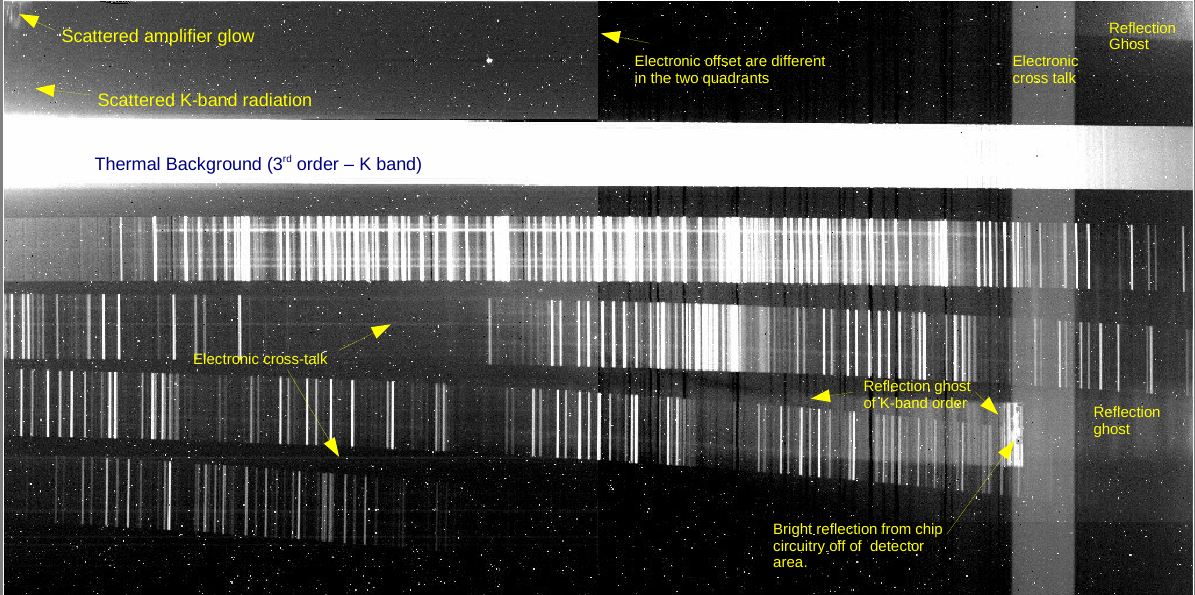
The image below shows a aggressive stretch of a deep (5 minute) TripleSpec spectrograph exposure. Evident is the thermal emission that covers the third order (K-band) and even a little of the long wavelength end (left side) of the fourth order). Atmospheric airglow is apparent in all orders, with the worst airglow appearing in the 4th order (H-band). This particular exposure was obtained in a dense field and multiple source spectra appear in the slit.
In addition to these "external" sources of light, the image also contains features resulting from electronics and internal scattering within the spectrograph.
Electronic ghosting: The most evident feature is the electronic crosstalk that appears when a bright source fills many rows/columns in one of the two array quadrants. This effect is most evident for the bright K-band order where emission filling the rows in in the left-hand quadrant produces an electronic ghost appearing as a vertical stripe of constant intensity in the right-hand quadrant. At a lower level, some of the bright spectral lines on the right-hand quadrant produce electronic ghost lines that cross the entire left-hand quadrant at constant intensity.
Optical ghosting: The brightest emission, specifically the K-band thermal emission, can be reflected about a point that is somewhat close to the center of the 2048x1024 array. This reflection produces an inverted stripe of emission that is evident in the right-hand quadrant just above the 6th order. This reflected strip ends in an intense bar this is acutually an image of some of the surface components and wirebonds on the detector wafer. Fainter reflection stripes are visible at a couple of other locations on the array.
Electronic quadrant offset/shading: At the level of a few DN the "bias" level on the detector can drift or be offset from one quadrant to another, producing a faint discontinuity across the quadrant boundaries.
All of these effects are repeatable from frame to frame and largely subtract out in the difference between two frames. The one place where residual features remain is the "stripe" electronic ghosts produced when observing bright standards. In this case, the level of ghosting is small compared with the source intensity, so the ghosts are of little consequence.
4.10. Array Persistence and Faint Targets
Bright sources produce an after-image on the array. This "persistence" image can linger for up to an hour following the observation of an extremely bright source. If a faint target is observed directly after a bright calibrator (e.g. K=7) the first few 5-minute exposures on the faint target may be contaminated with the spectrum of the calibrator (as a faint positive source in both the "A" and "B" positions). Observers should be careful to select fainter standards prior to faint source observations and should be aware of possible persistence contamination during data reduction.
Like DIS, TripleSpec uses independent TUI windows to position the source on the slit and acquire the spectra.
5.1. TripleSpec guiding with TUI
Choose "TSpec Slitviewer" from the Main TUI "Guide" pull-down menu. This guider window behaves functionally like any of the other TUI guider windows. Useful reference include:
Guider Match Scripts:
On arc-gateway there is a script that can be run from the institutional accounts that will match up the times od the slitviewer images to your science images and create a log of each science frame with the nearest guide image and the range of guide frames if a range exists. This script is called: tcam_match. For more details on using this script please see: Guider Match info.
5.1.a. Binning
Although the guider hardware always reads a complete 1024x1024 frame, the displayed image can be software binned to save on bandwidth. Users will find that setting Bin=2 will produce the cleanest and most workable images. In particular, systematic pixel calibration errors lead to vertical "jailbarring" in the images that can be time variable. This effect is visible at Bin=1, but averages out at Bin=2. This advantage alone makes Bin=2 preferable for seeing fainter sources.
5.1.b. Sub-framing
The TripleSpec guider will deliver portions of the full instrument frame, once again saving on bandwidth for remote observers. The "Window" area on the guider screen permits the user to drag the frame edges to a desired location relative to a full frame. Pushing the "Full" button returns to a full-frame display. Alternatively, one can zoom in on the guider display with the mouse and then push the "View" button to adopt the current view as the window area.
5.1.c. Background Subtraction
When background subtraction is engaged the existing frame is stored in a buffer and then subtracted from all subsequent incoming frames. The guider screen provides two buttons to control background subraction. The text on the left side of the background subtract bar indicates the current state (e.g. "Bkgnd Sub On" or "Bkgnd Sub Off"). When background subtract is turned on the next frame to arrive will be the first frame that is background subtracted. In order to see sources the telscope must be offset between the frame buffered for background subtraction and the subsequent frames (otherwise the sources will subtract from themselves).
- On/Off: The button that reads "Off" or "On" indicates the guider state that will be obtained if the button is pushed. If the button says "Off" it means the background subtract mode is ON and pushing the button will turn it off. If background subtract is turned on the frame number that is being buffered and subtracted from each subsequent frame appears to the right of the buttons and the left side of the bar will read "Bkgnd Sub On".
- New: Pressing the "New" button will update the frame that is stored in the background buffer for subtraction from subsequent frames.
Note that pushing the "On" button in background subtract mode does not start a new guider integration. One must engage the background subtract mode and then press "Expose" if the guider is not running.
Typical sequence after slewing to a new source:
- Decide on your guider integration time and acquire a frame to serve as the background image with "Expose".
- Choose Bkgnd Sub = On by pressing the "On" button.
- Move the telescope >= 5 arcsec.
- Press "Expose" for a single frame or engage manual guiding to view a steady stream of incoming frames.
- Identify the target star and move it into the slit.
Important tip:Background subtraction only works well if the saved background frame is "fresh". Even after a few minutes a mismatch can develop between the saved background frame and the actual background due to airglow, temperature, and flexure. Background frames must also have an identical integration time to the incoming frames. A new background frame is required (by either stopping and restarting background subtraction or by pressing the "New" button) if
- the integration time is changed.
- the telescope is slewed to a new source.
- significant non-celestial structure is visible in the guider frames due to a drift in the background level (usually after the saved background has become stale by several minutes).
- Spectra: /export/images/tspec/PROGRAM/UTDATE/
- Guide frames: /export/images/tcam/UTDATE/
5.2. TUI TripleSpec spectrograph control
Choose "Tspec" from the Main TUI "Inst" pull-down menu.
5.3. TUI TripleSpec Nod Script
Choose "Tspec Nod" from the Main TUI "Scripts" pull-down menu. Most TripleSpec data are obtained in slit-nodded mode where the source is positioned alternatively on the "left" (A) and "right" (B) portions of the slit. Pairs of the frames are subsequently subtracted to produce bias-free frames for data reduction.
The nod script is particularly useful for long integration on science targets so that users don't sit idle if they miss the end of a long integration. Since the objective of nodding is to permit airglow and background subtraction on several minute timescales (the time it takes those things to change) nodding can add inefficiency to short integrations (e.g. standard stars) since the nod and settle time tends to be longer than the frame-to-frame time. For bright sources a set of frames (typically 5) can be taken at the "A" position, the telescope should be manually nodded to the "B" position and another set of 5 frames taken there.
5.4. Data directories
5.5. Registering Guider Frames with Spectrograph Frames
Users select the names of their spectrograph data files while the guider frames accumulate serially through the night - t0001.fits, t0002.fits,.... The FITS header for the spectrograph files contains a keyword (SVFILE) that contains the guider frame acquired just prior to the start of the spectrograph integration.
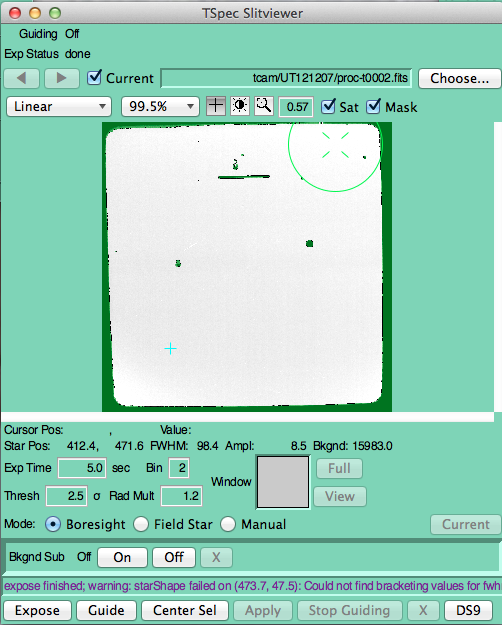
The TripleSpec TUI guider window. Functions/controls
are similar to guiders for DIS/Echelle. Remote users will want to
have 2x2 binning activated to minimize download time and to clean up
odd-even column striping. The platescale of the array is fine
enough that there is little penalty in resolution for running in the
binned mode. Sub-framing is available to improve response time for
remote observing. The detailed operation of this window is
described in Section 5.1. |
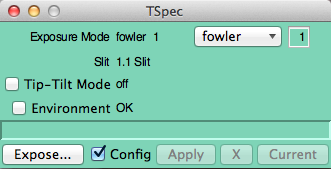
Main TripleSpec instrument TUI window showing
configuration. In this window the number of Fowler samples can be
set and the slit can be rotated to the desired position. Tip-Tilt
mode refers to a future mode of the instrument where the spectrum
can be steered at the sub-pixel level by a piezo-electric stage
under one of the fold mirrors in the system. Note that the
array power button should be left alone. It will likely be removed in
future versions of the GUI. Users should find the system fully
powered up and ready for operation after starting TUI. The "environment" button
provides instrument internal temperatures and pressure. |
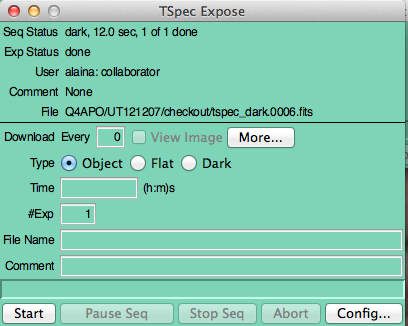
TSpec Exposure window: Integration times are set
and exposures initiated in this window. The "type" radio buttons
simply set a FITS keyword for the recorded data. The system can
take multiple exposures, ``#Exp" at the push of one button. This
function is particularly useful for bright standards where a set of
5 exposures can be taken consecutively at the "A" slit position
followed by 5 exposures at the "B" position to complete the
observation. ``Filename" is the root file extension. For example,
if "xxx" is chosen for the file name the resulting fits file will be
"xxx.yyyy.fits" where "yyyy" is an incrementing frame number that
increases steadily through the night. |
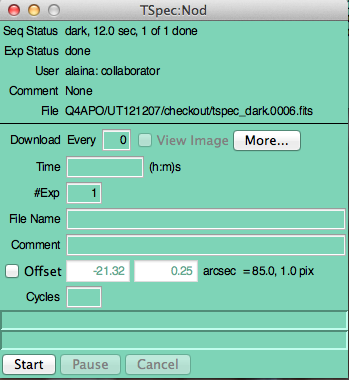
Nod Script window: Obtained from the "Scripts"
pull-down menu, this window has all of the functionality of the
Expose window, but also includes a "cycles" option which currently
drives the telescope in an "ABBA" slit position seqeuence for each
cycle requested. At each "A" or "B" position "#Exp" exposures will
be taken. For example, Cycles=2 with #Exp=4 will yield 32 frames
- an ABBAABBA sequence with 4 exposures at each position. |
6.1. Flat fielding and wavelength calibration
Like any spectrograph, TripleSpec requires both continuum and line illumination for flat-field and spectral calibration. The Triplespectool data reduction code currently uses airglow lines for spectral calibration. Spectral lamp observations are not necessary, but many observers may like the security of having traditional lamp spectra in reserve. In order to use the airglow calibration method some of the spectra must be free of source flux in the middle of the slit. Since the natural observation procedure is to offset the source between two off-center slit positions, standard TripleSpec observations naturally provide for airglow wavelength calibration. In general, observers should be sure to have a few observations with only airglow at the slit center for wavelength calibration.
- No illumination - only continuum thermal radiation from the telescope and dome evident at the longest wavelengths.
- Bright quartz lamp on for continuum illumination.
- On Feb 9, 2012 the Bright and Dim Quartz truss lamps were upgraded on the telescope. This changed the recommended exposure times for flat fields for some instruments, but the TSPEC recommendations remain the same.
- Neon and Argon lamps on for spectral calibration - (observers may wish to acquire a few such frames as a backup).
- Darks - No darks are required for TripleSpec data analysis since all reductions are done differentially between pairs of images, both of which contain the same "dark" bias and dark current contributions (see 6.3.)
A typical calibration sequence to be conducted once each night (possibly once per run) consists of ten 60 second exposures that include:
Not needed are:
6.2. Telluric and flux calibration
- Cushing, Vacca & Rayner 'Spextool: A Spectral Extraction Package for SpeX, a 0.8-5.5 Micron Cross-Dispersed Spectrograph' -URL
- Vacca, Cushing & Rayner 'A Method of Correcting Near-Infrared Spectra for Telluric Absorption' - URL
7th-9th magnitude A0V stars are ideal calibrators for most TripleSpec observations. The Triplespectool pipeline and this calibration method are described in:
TripleSpec observers that make use of Mike Cushing's Triplespectool should refer to the tool as a 'modified version of Spextool' in the paper text and reference the above papers.
Aside from broad hydrogen line absorption, A0V stars have few other intrinsic features. The overall A0V spectrum can be well modeled and is fit and removed from the target spectrum in one step of the Triplespectool data pipeline.
Note that for solar-system targets observed in reflected sunlight a G2V standard is reqired instead of an A0V standard. Direct division by the G2V standard will provide correction both for telluric absorption and for the solar absorption spectrum with no modeling require. This option is available in the Triplespectool pipeline.
For proper telluric absorption correction (which can be time variable due to the changing water vapor content of the atmosphere) it is important to observe an A0V calibrator close in time, in airmass, and ideally in angular separation from the science target.
The files below contain thousands of potential A0V and G2V standards to aid in selection of a calibrator .
6.3. Why no Dark Frames?
The TripleSpec slit wheel drive has 8 positions. Four of these positions have spectrograph slits. The other four positions in between the slits block all light from entering the spectrograph. Technically it is thus possible to take true dark frame, but in practice true darks are not necessary. Although this statement seems counter to standard observational practice, it turns out that dark current and frame bias are naturally accounted for in the differential procedures that underlie standard TripleSpec data acquisition. In particular, all spectra are obtained in differential mode - either A/B positions on the slit or on-slit vs. adjacent sky. In each case, data processing takes place by operating on the difference of pairs of frames. The underlying dark current and bias (and thermal background) are subtracted automatically. Similarly, when observing calibration lamps an equivalent length exposure is taken with the lamps off so that dome thermal emission is the only source of illumination. When pairs of lamp-on vs. lamp-off frames are subtracted the dark current, bias, and thermal backround all are removed leaving only the source spectrum.
-
TripleSpec includes a dedicated spectral extraction routine - Triplespectool - that converts TripleSpec images to one-dimensional telluric-absorption-corrected absolute-calibrated spectra with flexibility for selecting spectral apertures for both point and extended sources. This link points to the latest available version of a Tspectool installation and use guide (TSpecTool_guide) as well as the actual software packages.
- Cushing, Vacca & Rayner 'Spextool: A Spectral Extraction Package for SpeX, a 0.8-5.5 Micron Cross-Dispersed Spectrograph' -URL
- Vacca, Cushing & Rayner 'A Method of Correcting Near-Infrared Spectra for Telluric Absorption' - URL
Triplespectool is based on the Spextool package developed by Michael Cushing for use with the Spex instrument at the IRTF. TripleSpec observers who make use of Mike Cushing's Triplespectool should refer to the tool as a 'modified version of Spextool' in the paper text and reference the above papers.
Please find additional information for taking and reducing data here.
0.1. Revision History
0.2 - first issue
0.2a - Serious swap of J and Ks sensitivities in the table below fixed
0.3/0.3a - Shared-risk user input accommodated including enhanced description of background subtract procedure.
0.3b - Added quantitative guidance for on-the-fly focusing based on astigmatism; added a section on persistence contaminating faint source observations (4.10)
0.4 - Updated calibrations section to account for the fact that Triplespectool now performs wavelength calibration based on airglow lines.
0.5 - Updated version of TSpecTool_guide available.
0.5b - Included section on detailed breakdown of events during an exposure sequence and resulting timing.
0.5c - "-0" problem in G2V and A0V standards files corrected and noted that it is possible to saturate the slit viewer in long exposures.
0.6 - Updated TSpecTool and TSpecTool_guide0.2. Updates
2008JUL24: The rotator restriction on TripleSpec has been removed.
